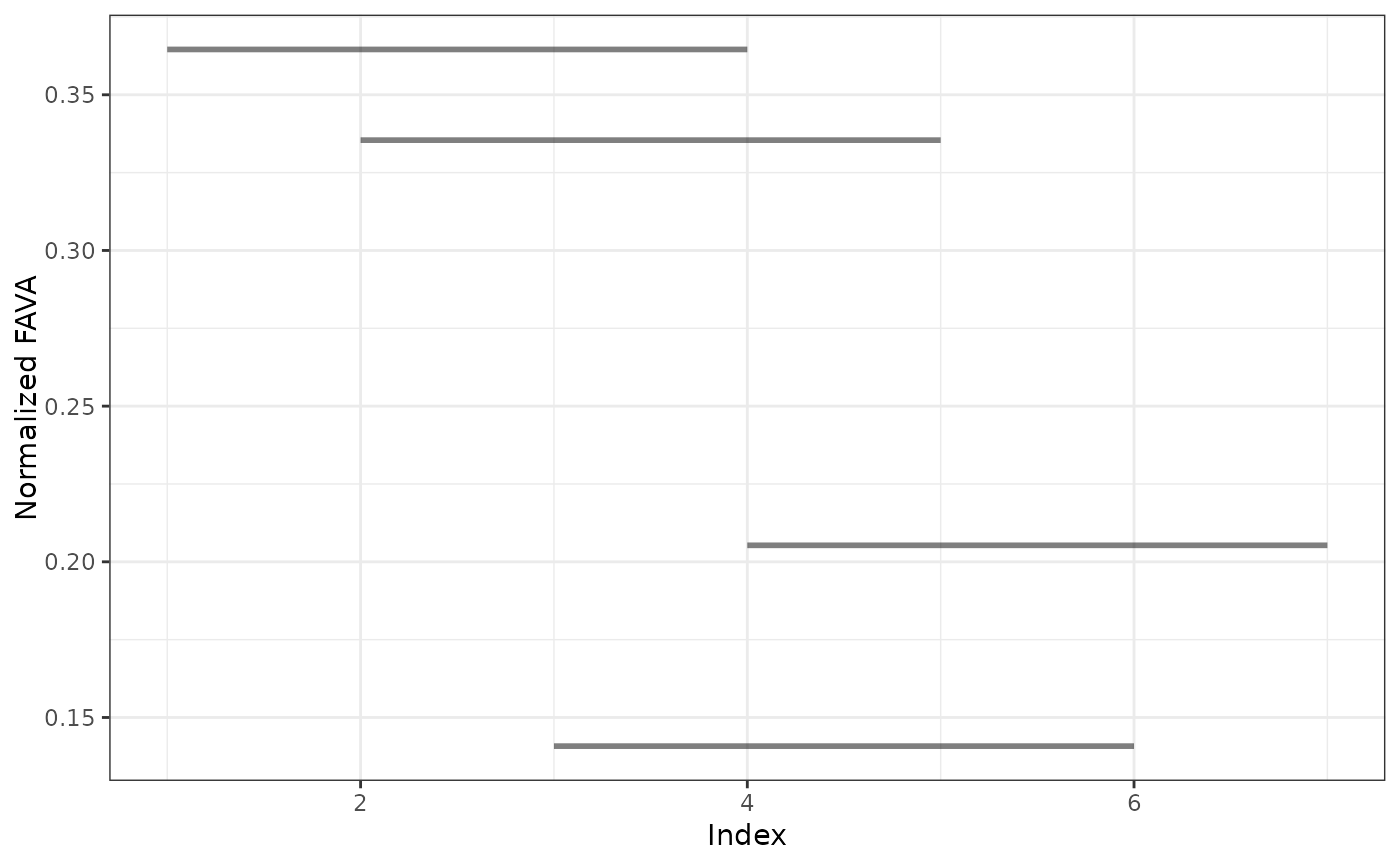
This function generates a plot of normalized or unnormalized, weighted or unweighted FAVA computed in sliding windows across samples for one or many groups of samples.
Examples
A = matrix(c(.3,.7,0,.1,0,.9,.2,.5,.3,.1,.8,.1,.3,.4,.3,.6,.4,0,0,.5,.5),
           ncol = 3, byrow = TRUE)
window_out = window_fava(relab_matrix = A, window_size = 4, normalized = TRUE)
window_out$window_data
#>        FAVA window_index w1 w2 w3 w4
#> 1 0.3645621            1  1  2  3  4
#> 2 0.3354307            2  2  3  4  5
#> 3 0.1408005            3  3  4  5  6
#> 4 0.2052980            4  4  5  6  7
window_out$window_plot
